

With Google’s old Universal Analytics (UA) platform set to shut down on 1st July 2024, here’s a look at the different options for saving your historical website data and guidance on what you should keep.
Save your Google Universal Analytics (UA) reports before access goes on 1st July 2024
Google’s old Universal Analytics website reporting platform stopped tracking data in July 2023, as part of their enforced move to the newer Google Analytics 4 platform. For a period of time, users can still access historical reports in the UA platform, but this is due to come to an end. From the 1st July 2024 Google will be closing down all access to the UA platform meaning users will lose access to their historical website tracking reports.
If you’re familiar with Google Analytics and have been using it over the last 6-12 months, you’re hopefully already getting used to using GA4 (check out our tips for getting started with GA4). Perhaps you haven’t even logged into your old UA reporting property recently.
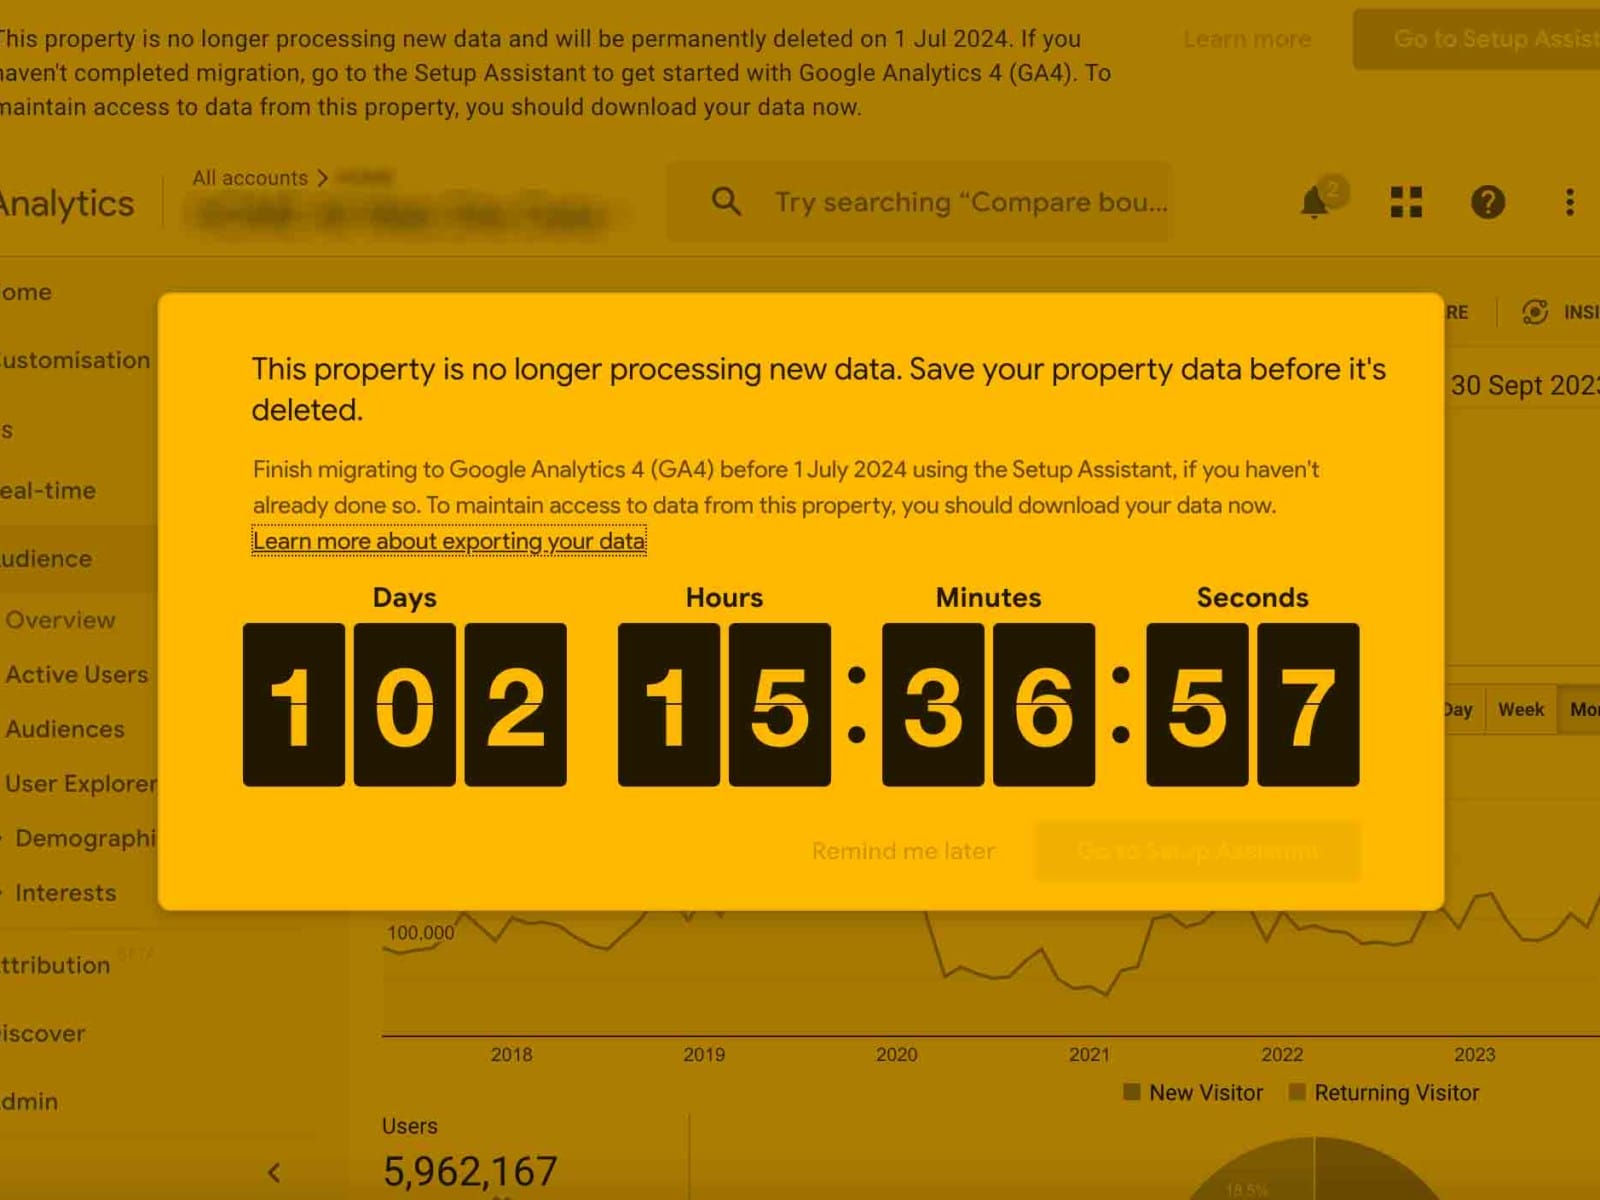
If you do log into a UA reporting property, you will notice your screen taken over by a countdown timer, advising you to “save your property data before it’s deleted”.
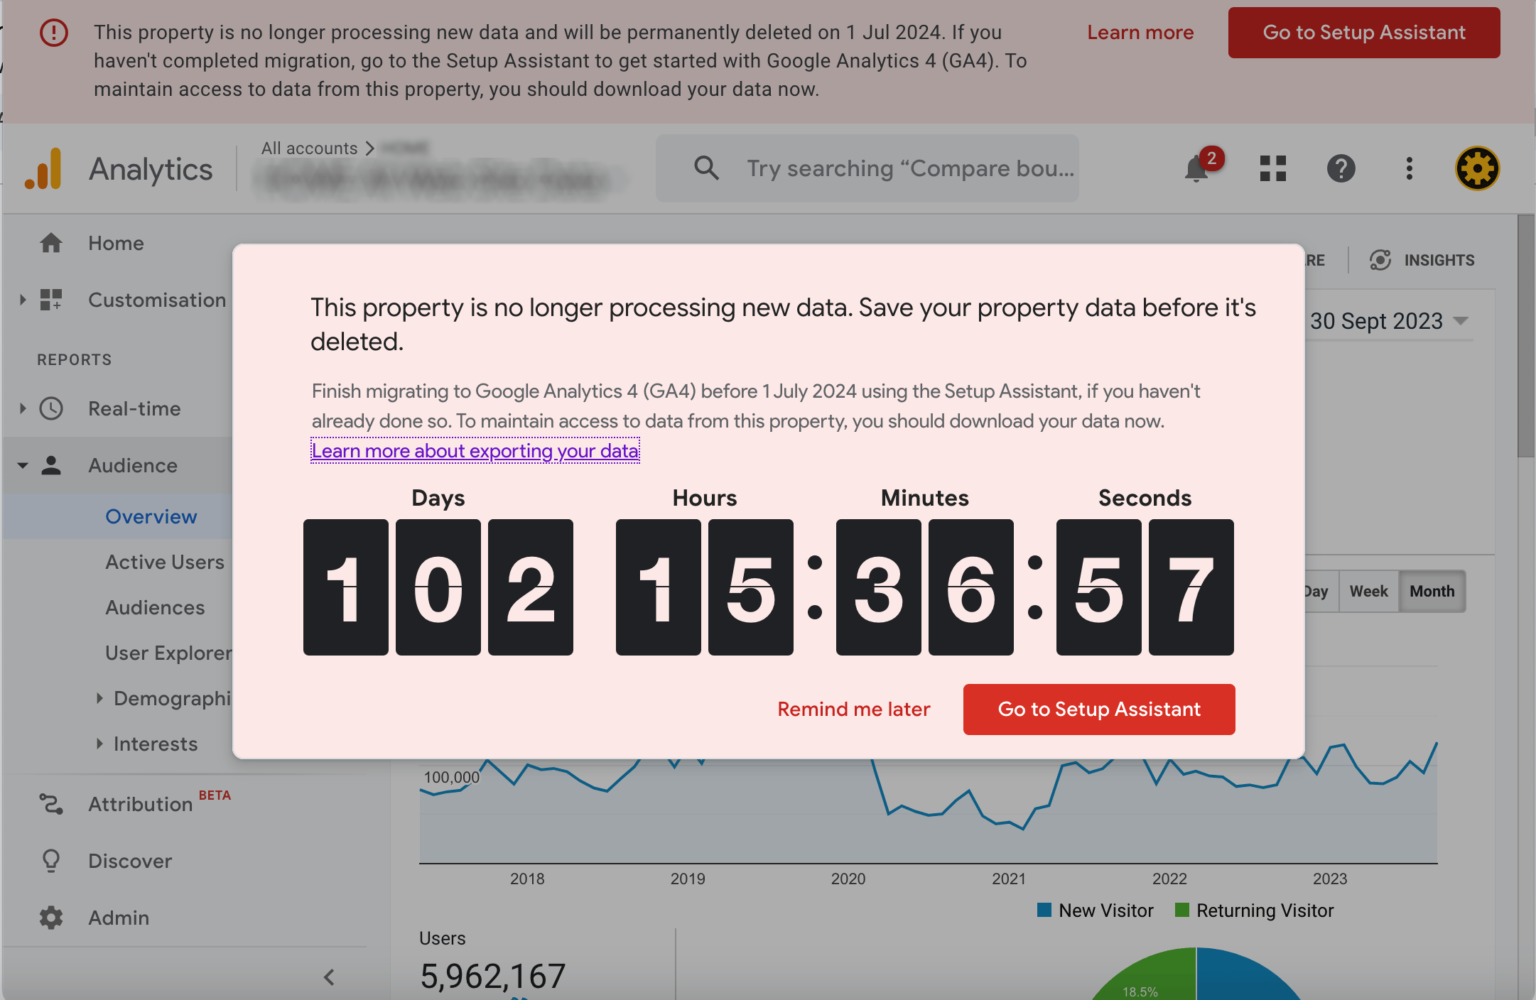 Google's not very subtle reminder that your UA properties will be shutting down completely
How to download your data from UA
The “how” is relatively simple: after you’ve logged into your UA reporting property, if you see the countdown timer, click the “remind me later” option to dismiss it and then click into a report of your choice. Once you’re on a report, look for the “Export” button at the top right of the page – this appears above the date selector.
Clicking the “Export” button opens a drop down menu with four options for methods to export the data:
- Google Sheets
- Excel (XLSX)
- CSV
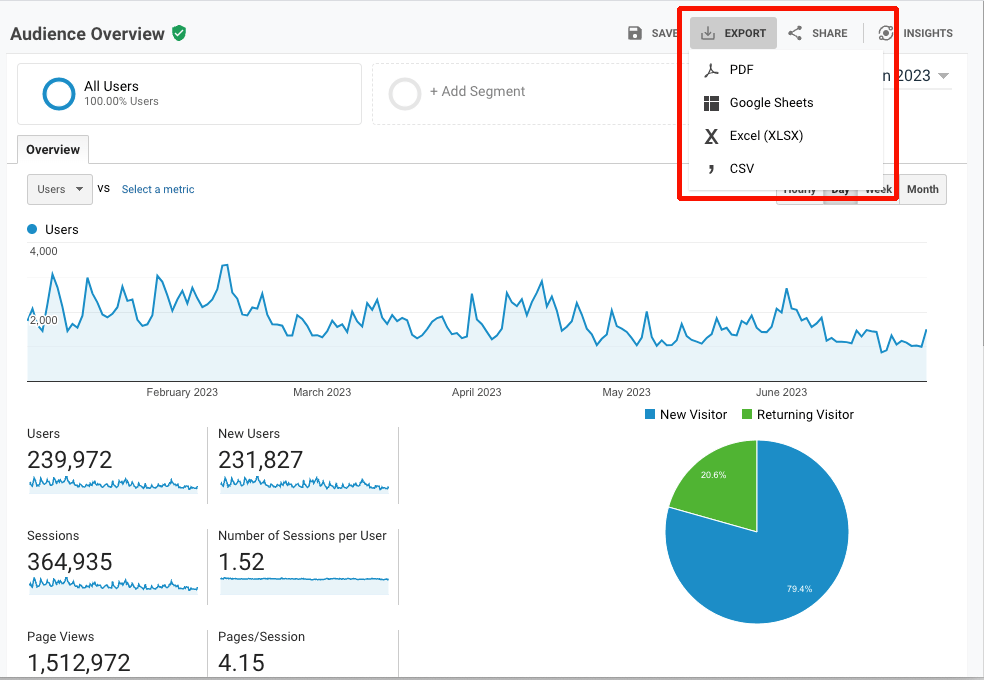 The "Export" options for saving your data
The PDF option will give you a static pdf version of the visuals you can see on screen including any graphs and pie charts. The other three options (Google Sheets, Excel, CSV) will give you just the numbers in a spreadsheet, offering the flexibility to do any calculations, reorder the data to suit your needs or copy and paste multiple reports into a single document.
What data and reports should you download?
There are numerous reports within the UA reporting platform so it wouldn’t be practical to download them all and realistically you probably won’t need to access all of the detailed historical reports. Here are some prompts to help you decide what to keep for future reference.
Check when your Google Analytics 4 (GA4) property was set up
Many organisations had the newer and current GA4 reporting set up and tracking website activity long before UA switched off. Does your GA4 account have a full 12 months of data? Do you already have reports saved outside of the platform showing your website stats from more than 12 months ago?
As a general recommendation, if you have GA4 reporting going as far back as January 2023 and have reports saved with website stats from before this (perhaps in the form of reporting for your Board or funders), then you may choose not to download your historical UA reports at all, because your GA4 reports and your archived reports cover all your needs.
Overview reports of basic website metrics
There are three high level metrics that I’d recommend you keep a record of. These metrics give an overview of your website usage and are often the metrics that non-marketing stakeholders and funders will be interested to know:
- Users – the number of users who came to your website
- Sessions – the number of times those users visited your website
- Pageviews – the number of pages viewed by those users
The Audience > Overview report contains the key metrics mentioned above so if nothing else, I’d recommend downloading a PDF of this report.
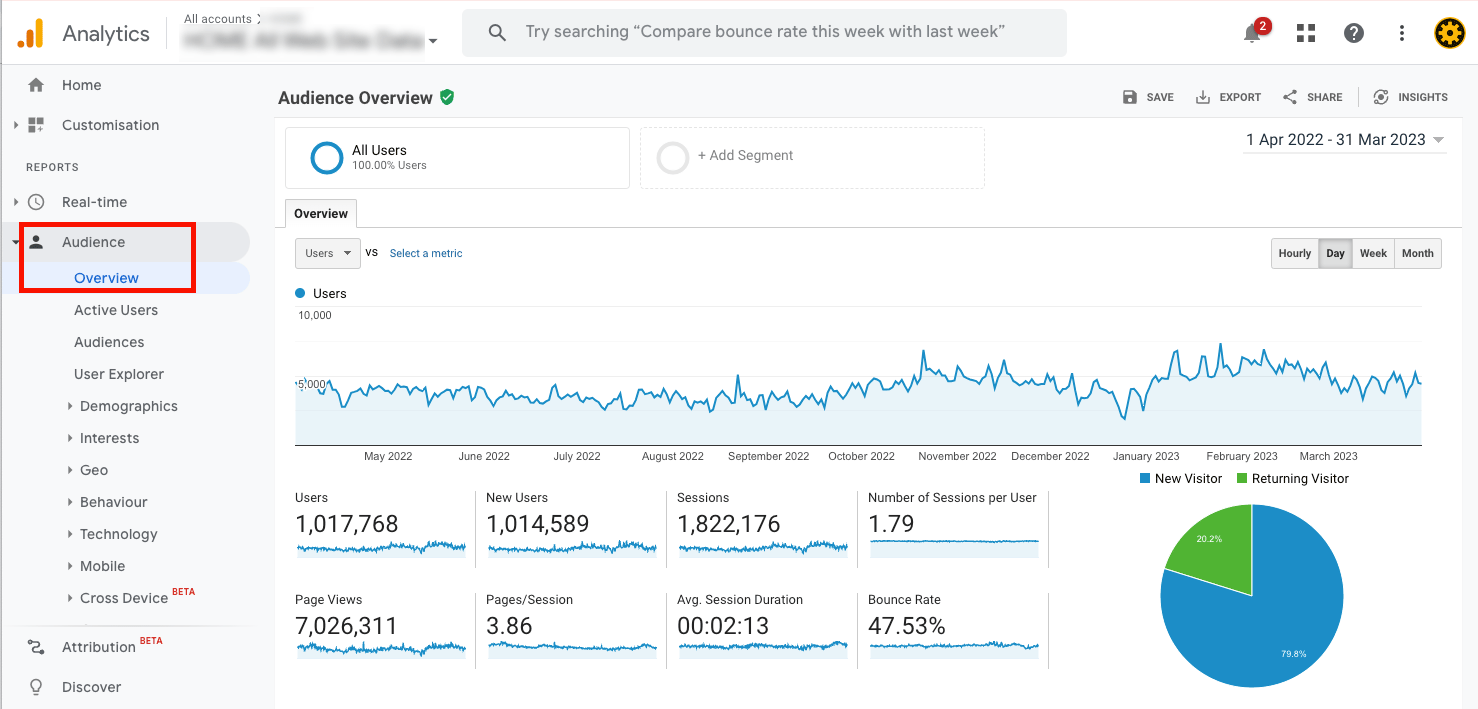 The Audience Overview report is good basic report showing key metrics
What are the website reporting requirements from your funders?
You may be regularly reporting on website data to your funders, but if this is something you usually only look at on an annual basis, then you may have some essential data stored in your UA account that you won’t want to lose.
Check your funder reporting requirements and save the relevant reports you’ll need, for example some funders may be interested in pageviews for certain parts of the website, the number of file downloads, or demographic information.
Seasonal trends and year-on-year comparisons
Another thing to consider is the date range you want to set for your reports. Do you just need the totals for a calendar year or a financial year? Or if you’re interested in seasonal trends, is it useful to have your historical key metrics data broken down by month?
One way to get a download of your metrics broken down by month (without having to download a different report for each month) is by using the Google Sheet, CSV or Excel download option.
When you choose one of these options, you will also get a numerical breakdown of the data which is visualised in the UA platform in a chart and this numerical breakdown can give you the figures for each month. Here’s how to get this data:
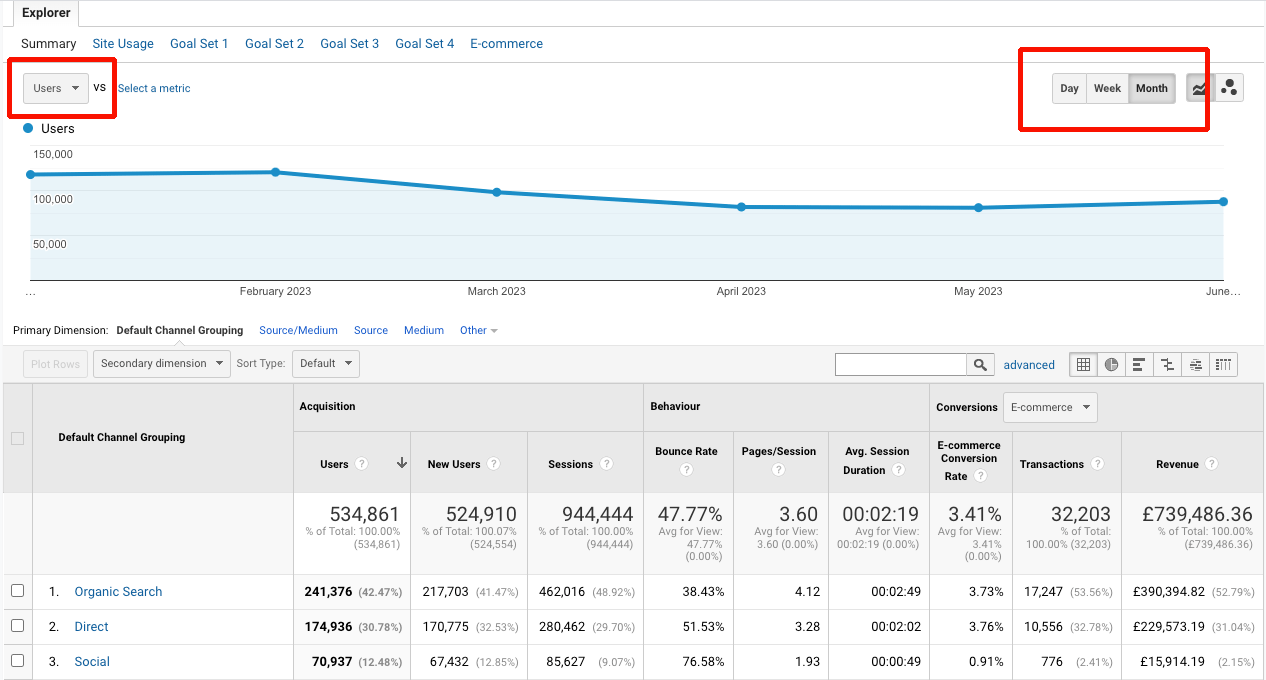
- In the UA platform, navigate to the report you want to export. In the example below I have selected the Acquisition > All Traffic > Channels report.
- Then set your date range. In the example below I have set it to 1st January 2023 – 30th June 2023.
- Use the buttons at the top right of the chart labelled Day / Week / Month and select “Month”. This will update the points on the chart so they show each month.
- On the top left of the chart there is a drop down option to select the metric you want to shown on the graph. In the example below I have set it to Users.
- When you have your graph all set up as desired, click the export button and choose one of the spreadsheet options.
 How to adjust the settings on your graph to get a monthly breakdown
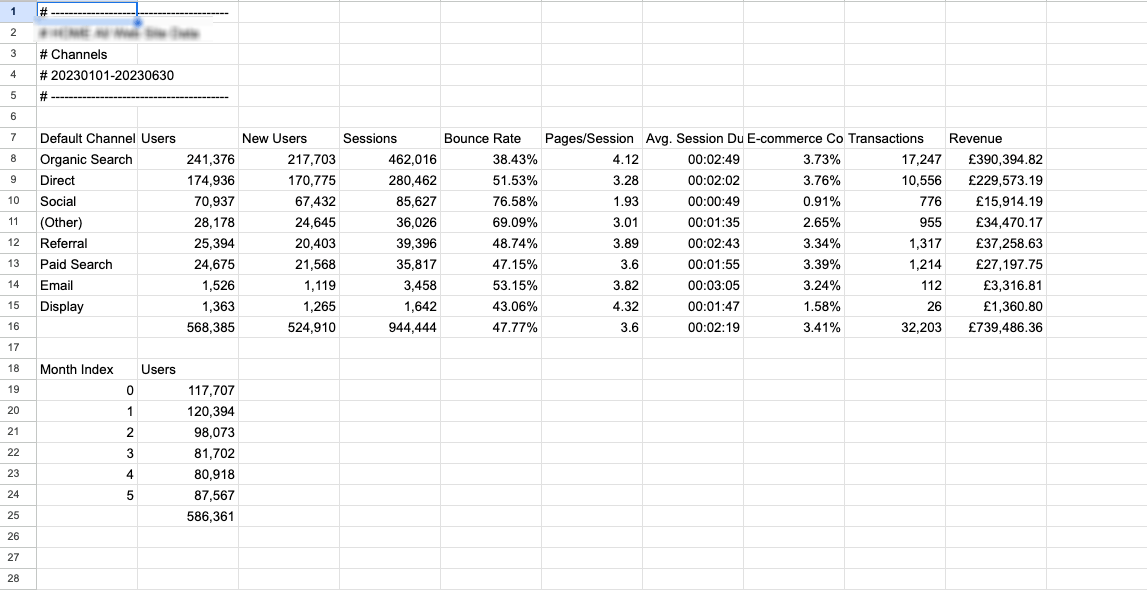
When you open your spreadsheet you will see the chart data listed alongside a “Month Index”. See the example below.
To make this report more useful for you in the future, you may want to replace the Month Index with the name and year instead. If you’re wanting to save a number of different metrics, you can repeat the process, then copy and paste all your data into a single sheet.
What information might future team members and suppliers need to know?
When the team at Cog receive briefs for new website projects, these are often accompanied by a summary of the current website statistics. When we start a new project, we also conduct our own review of any available website analytics data. This kind of data can also be an important part of funding applications – particularly for web projects.
When the UA reporting platform is switched off, is there any key information stored in there that would be essential for a new team member or supplier to know? Also think about context for the data, as this can be as important as the raw figures themselves. If you’re downloading a report for future reference, is there some commentary that should go with it? For example perhaps there was a season or a show which caused an otherwise unusual spike in traffic one year, or a campaign where you had additional budget for social media ads that caused an increase in visits.
A note around Google’s 1st July 2024 deadline
A note for anyone who happens to be reading this article after the 1st July 2024 deadline. Although Google has added the big red countdown timer as a warning that they will be switching off UA reporting access, they have said the date is from 1st July 2024 as opposed to on the 1st July. This usually means they’re doing the switch off in batches and it could take a few days or weeks before you lose access. This means if you’ve left it very late to download your UA reports, don’t panic as you could still have access for a short time after the official deadline.
We’d definitely recommend doing it sooner rather than later!
Related

Five tips for website analytics using GA4
Nazma shares 5 of her top tips to take your website reporting into 2024 using Google Analytics and their GA4...

Introducing Google Analytics 4
Google have updated their Analytics platform recently. Emily takes a look at some of the key changes in Google Analytics...
29 July ’20
Emma’s listening to Chris Unitt talk about Google Analytics this afternoon.
27 March ’24
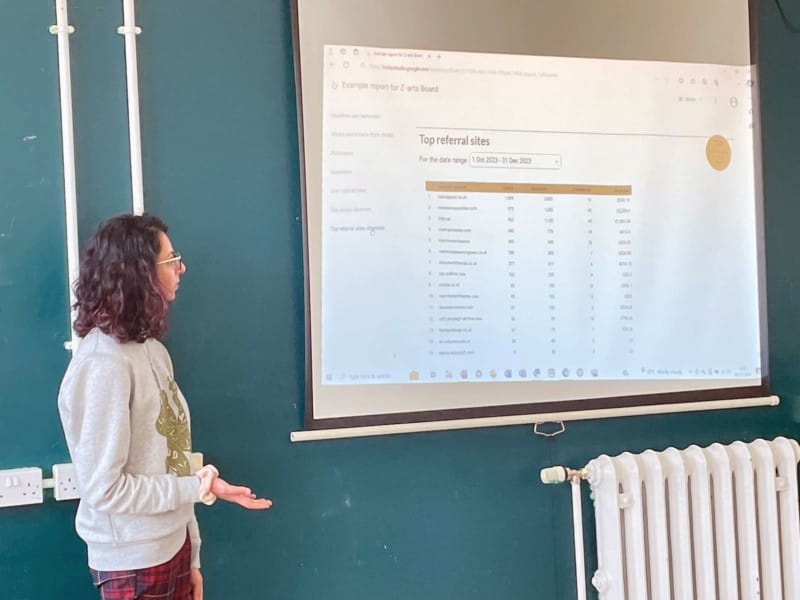
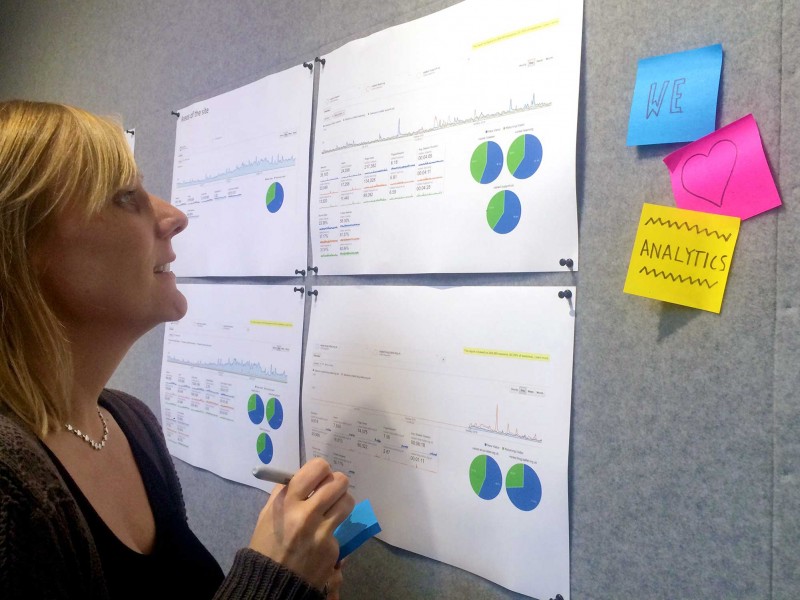
At the Z-arts Board Away Day, Nazma shared the website analytics dashboard we created for them.

21 September ’23
After an exciting session on Google Analytics, Nazma posed for a staircase selfie with Vicky and Paula at Royal Exchange...

20 August ’15
Sam and Becca are having a Google Analytics healthcheck with Jackie and Minnie from Crying Out Loud.

17 December ’19
Chris Unitt is here to teach us more about Google Analytics.
13 June ’16
We're all about the analytics this Monday as Sam prepares for a kick off meeting with a new client.
30 November ’22
It was great to see our friend Nazma, speaking at the AMA Digital Day at The British Museum. Thanks for...