
Nazma shares 5 of her top tips to take your website reporting into 2024 using Google Analytics and their GA4 platform.
Five tips for website analytics using GA4

When I joined the Cog team as a Digital Strategist at the start of February 2023 I was excited to get into Google Analytics and working with clients on their web data and reporting needs. It was also an interesting time for website reporting as Google was preparing to close their Universal Analytics (UA) platform and move everyone over to their new platform Google Analytics 4 (GA4).
Over the past 10 months I’ve been running GA4 webinars, 1:1 training sessions, customised the platform, built reports in Looker Studio, set up custom tracking and answered lots of questions from clients.
I wanted to share some of my learnings, examples and useful information that could help you on your plans for web data analytics and reporting – particularly if you’re in the arts and culture sector.
(Most of this is written for readers who have some knowledge and experience using Google Analytics, if you’re completely new I’ve included some general resources at the end of my five tips).
1. Ask Analytics Intelligence
Let’s start with a tip for beginners to the GA4 platform. Your first look at GA4 can seem confusing, particularly if you’re used to using the old UA reports with their navigation and report titles. One of the easiest ways to learn is to use the search bar at the top to “Ask Analytics Intelligence”. Similarly, look out for the “Insights” button to see what quick insights you can get from the data.
Analytics Intelligence will give you a quick response to your question and it can guide you to which reports to access for more detail.
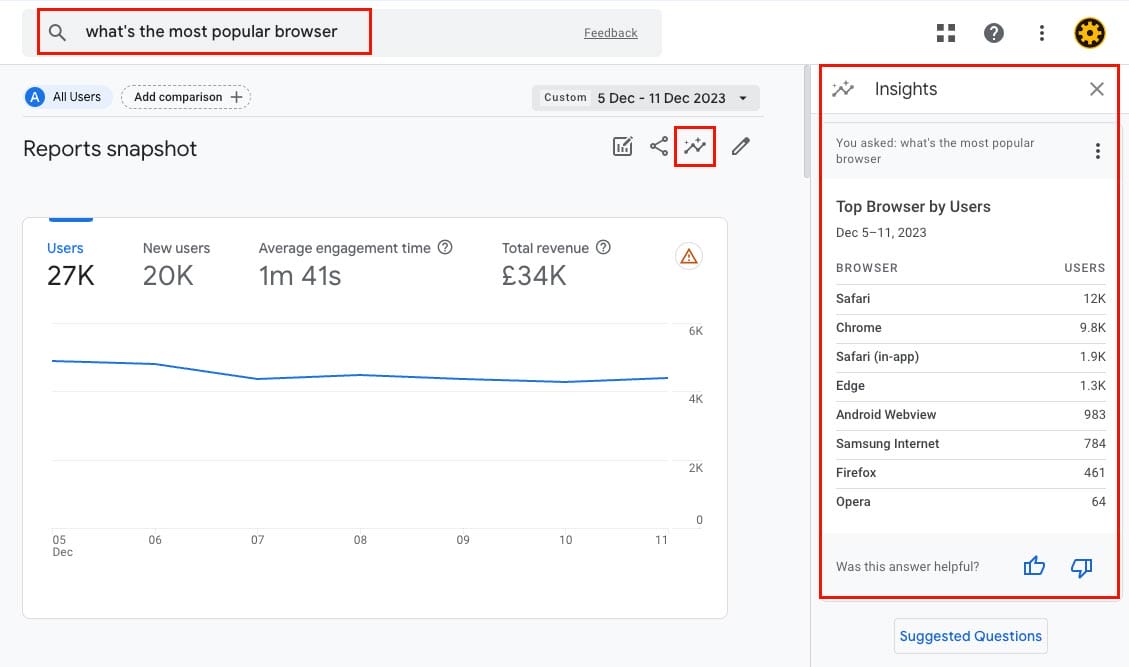 One of the outputs from Analytics Intelligence
2. Check your paid social and organic social traffic is being reported accurately in GA4
One of the most common reporting errors I have spotted across GA4 accounts is how social media traffic is categorised. GA4 has a set of “default channel groups” which are categories it uses to define where your traffic comes from. You can find this in GA4 under Reports > Life Cycle > Acquisition > Traffic Acquisition. Two of these “default channel groups” are Organic Social (the general content you post on your social channels) and Paid Social (the posts that you pay to be displayed in particularly places).
For some clients who I knew were running social media ads, I noticed that their paid social posts were being included in the Organic Social traffic in GA4 reports, making it difficult for them to see the value of the investment they were making.
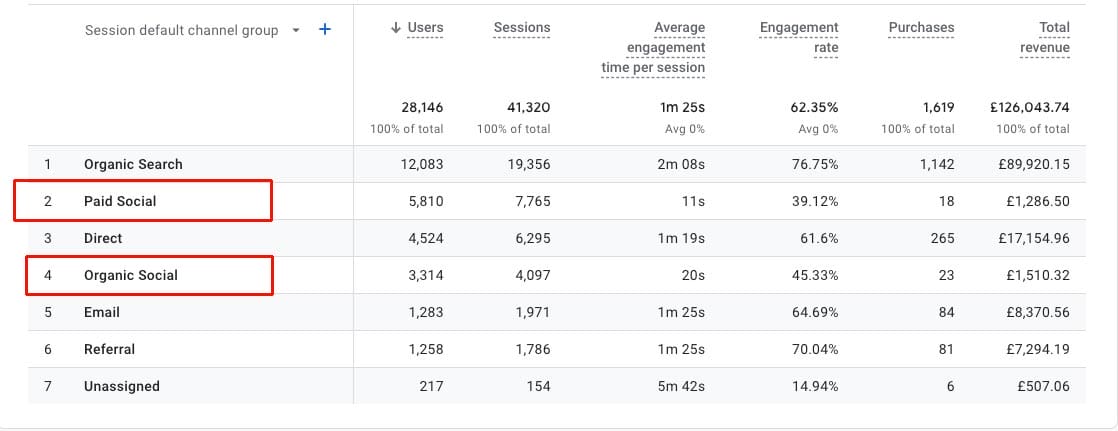 The Default Channel Group report in GA4
The way to get GA4 to pick up the difference between your Paid Social and Organic Social posts is to use custom tracking urls in your ads.
Google has a Campaign URL Builder which can help you create tracking urls and has a resource guide on how they define their default channel groups for GA4. It’s pretty detailed, so I’ll tell you here what you need to use in order for the traffic to be categorised as Paid Social:
Medium=Paid
Source=[the name of the social channel] .
From experience using Google’s campaign url builder I know it can be easy to make mistakes with what to put in each field, if for example you put “Facebook” into the “Medium” field instead of the “Source” field, then the traffic will be categorised by GA4 as “Other”.
To help solve this problem, for some of the Cog clients I’ve been working with, I have created a custom campaign url builder, which is a Google Sheet with drop-down options and corresponding auto-filled columns to make the process smoother and avoid errors (get in touch with me if you’d like to know more about this).
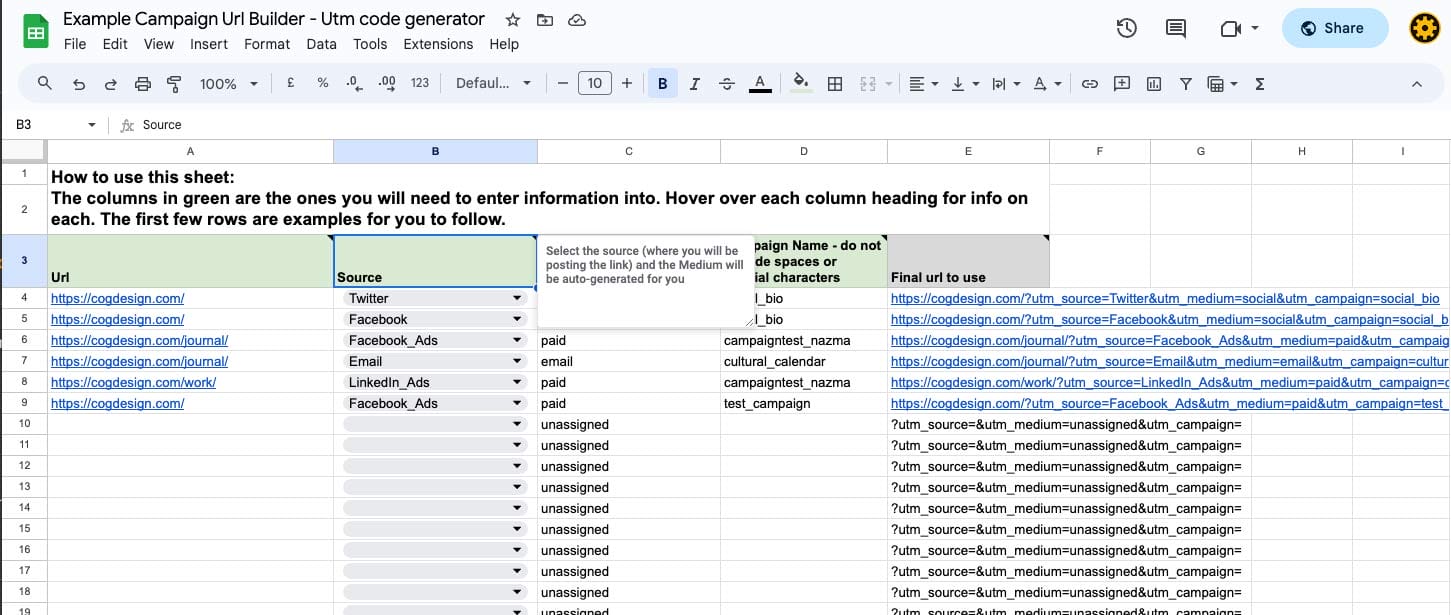 An example of the campaign url builder I've created for some Cog clients
3. Hide the reports and metrics that aren’t useful to you
GA4 offers the option to customise the interface you see, from the reports that appear in the menu to the metrics within the reports. Hiding the reports and metrics that aren’t useful to you will make it easier for you and your team to navigate the reports and get the insights that are important to you quicker.
Sophia Wycisk from Measure School has written a step-by-step on how to do this: How to customise your Google Analytics 4 reports.
Some of the reports that I often recommend can be hidden, for arts and cultural organisations are:
– Monetisation section – In-app purchases
– Monetisation section – Publisher ads
– Monetisation section – Promotions
– Retention section including Retention overview
There will likely be others that you can identify based on your needs, which takes me to the next point…
4. Take a step back and think about your reporting strategically
The switch to GA4 and a new reporting platform is a great opportunity to evaluate what you’re reporting on and why. GA4 is filled with lots of interesting and in-depth information about your website users; it’s all interesting but how much of it is strategically useful for you to have at your fingertips? Think about how much of this is “nice to know” and what information is going to help you drive marketing decisions.
And remember that the data needs to be shared, interpreted and acted upon if it’s going to be useful. Think about how often you and your team are reviewing this data and what platforms you use to do that. Are you then having the conversations to take actions based on the findings?
A few of our clients have mentioned to me that they don’t always have time to check their website data even though they know it could be useful. If this sounds familiar, my recommendation is to set up email alerts directly from GA4, to give you a check-in prompt. Look out for the “share” icon and click to see email options.
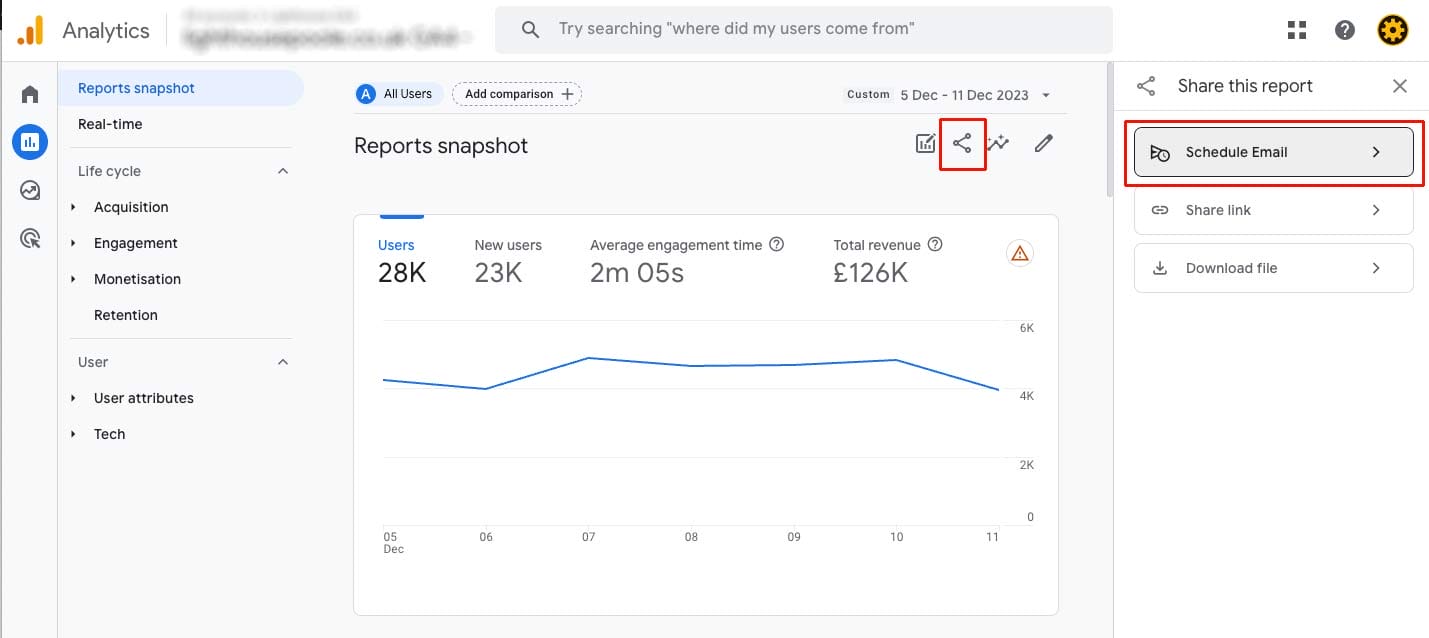 The share icon and Schedule Email options in GA4
5. Consider using a data visualisation platform for more efficient analysis
Once you know the capabilities of GA4 and have identified the key information that’s important to you, there’s so much more you can do with it. We’ve been using Google’s Looker Studio (formerly known as Data Studio) to create interactive reports that reduce the need to navigate GA4 and give clients the top level stats they need to see.
As well as offering more convenience in accessing the data, these custom reports also offer more sophisticated ways to analyse the data and make comparisons.
They can be the perfect way to share easily interpretted snapshots with your board or with key stakeholders.
Here’s one example Looker Studio report
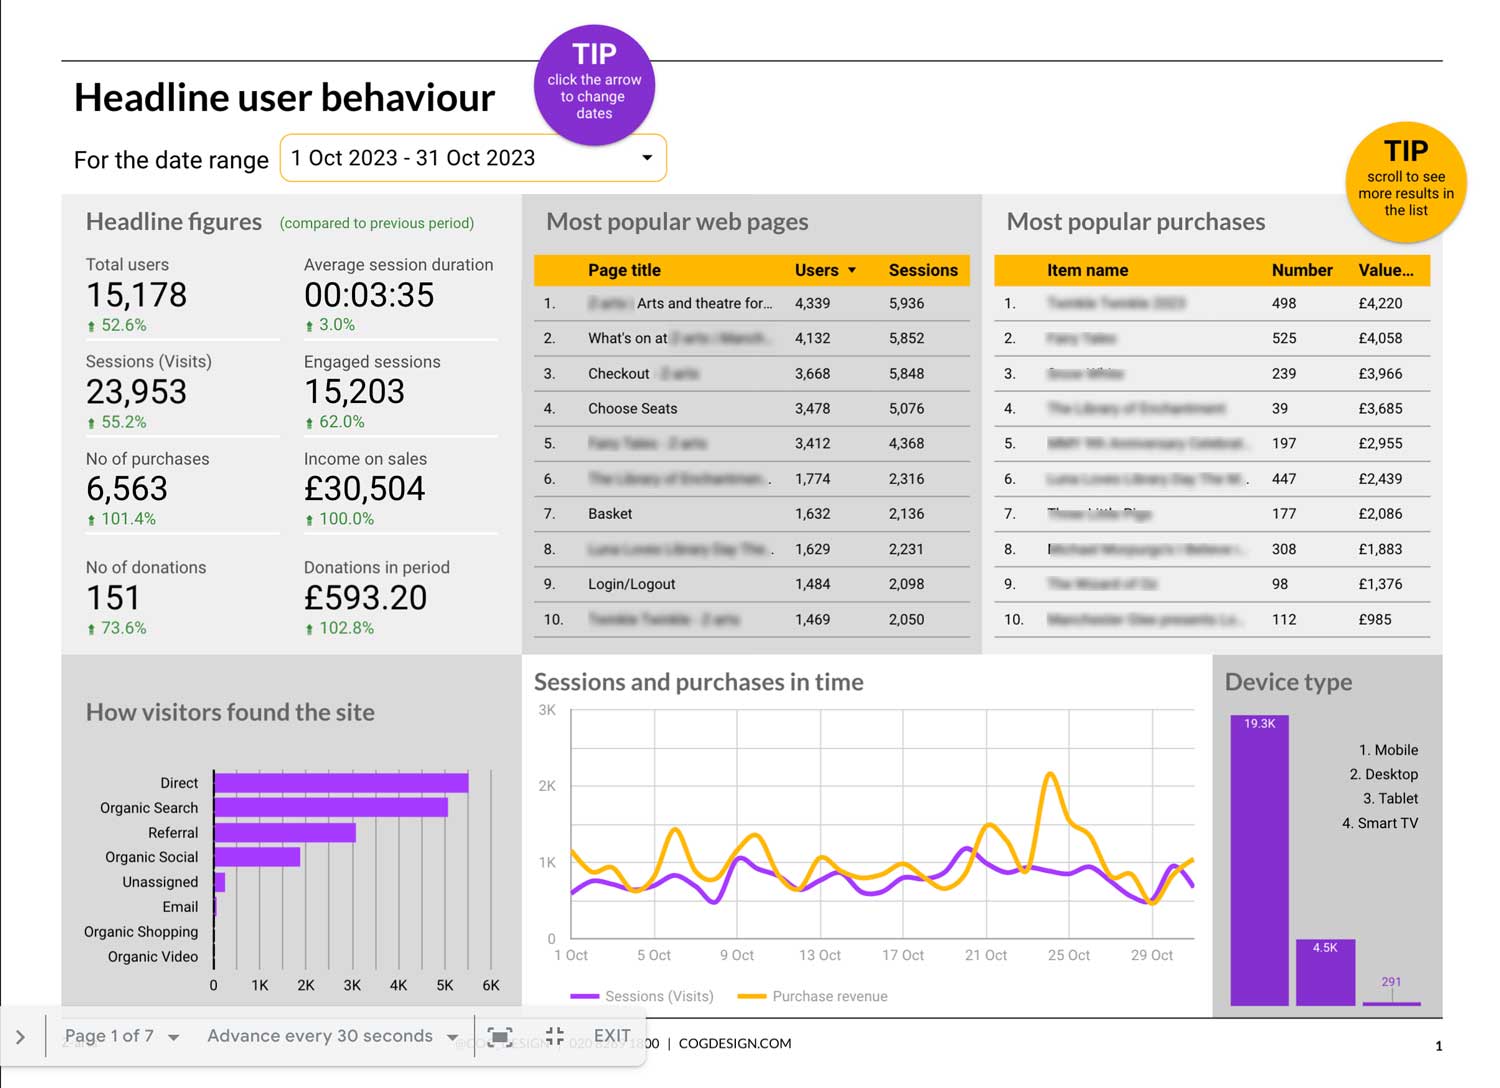 An example of a Looker Studio report created for a Board Report
Other examples we’ve created include:
- For one orchestral client we set up a report with targets added so they can monitor progress throughout the month, with control buttons to quickly switch to view performance by device.
- For one of our theatre clients we created a report to monitor user interactions on event pages, with control buttons so they can easily switch between different events pages.
- Reports that combine data from multiple sources, including Google Search Console.
If you’d be interested in seeing some of these examples and having a chat about your reporting needs, get in touch.
General GA4 resources I’ve found useful
I thought I’d finish by sharing some of the resources which have helped in my GA4 journey so far.
- Loves Data YouTube Channel
From guides for complete beginners to more detailed tracking setup, there are a mix of longer and shorter videos. - Analytics Mania blog
I’ve found the detailed information on this blog particularly useful when it comes to more tricky tracking setup using Google Tag Manager. They also have a YouTube channel if video is your preferred learning style.
I’ll also be running a GA4 reporting webinar in January/February (date to be confirmed!) so drop me an email if you’d be interested to attend and I’ll ensure you’re on the list when the date is announced.
Related

Live-streaming: frequently asked FAQs
Here are our top ten tips for writing the best FAQs for live-streamed events.

SEO in the cultural sector
Search Engine Optimisation (SEO) is important to any cultural sector organisation. In this article Michael gives an overview of the...

SEO Resources – Arts Marketing Association Digital Day 2023
Cog's Digital Strategist, Nazma Noor, has put together some useful links and resources to accompany her SEO talk at the...

SEO for arts & culture organisations
SEO (or search engine optimisation) can seem daunting, but if your site is well structured, your content well written and...

Introducing Google Analytics 4
Google have updated their Analytics platform recently. Emily takes a look at some of the key changes in Google Analytics...